AceFileViewer
AceFileViewer is not a simple tool to visualize the contents of Ace files but it is designed to conduct finishing efficiently.
How to get started
Before get started you need an empty folder, which will be used to store files that are created by AceFileViewer. After selecting a folder, select an Ace file that you want to analyze. By selecting an Ace file, a series of calculations is started. You will have to wait until all calculations have finished. Then, you can open viewers.
In the initial calculations, three files (454ContigGraph.txt, 454AllContigs.qual, 454AllContigs.fna) are optionally created, which can be used as input files for GenoFinisher. A file named "connectioninfo" is also created that can be imported to GenoFinisher.
How to analyze a contig
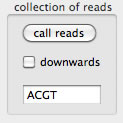
Simply set a contig number and then press the "load" button. If you want to reverse complement the contig sequence, check the "reverse" check-box.
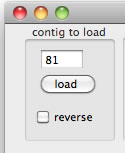
To load contig00081, set 81 and then press the load button.
How to set a contig context
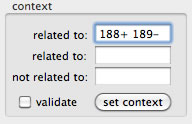
AceFileViewer can show reads that fit to a given context. There are three text box to set a context. The top text box is mainly used. To show reads constituting contig12 that are related to contig188 or contig189, set "188 189". You can set as many contig numbers as you want (space-delimited). It is also possible to specify the context as "188+". Here "188+" results in reads of contig12 that constitute 3' end of contig188 or whose mate belongs to contig188 and heads for 3' end of contig188. Once a context is set, check the "validate" check-box to validate the specified context.
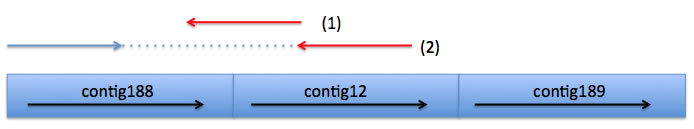
Two reads (1) and (2) fit to a context of 188+, because read (1) constitutes 3' end of contig188, and read (2)'s pair belongs to contig188 and the pair heads for 3' end of contig188.
Automatic determination of context-complient DNA sequence
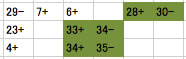
To automatically determine a DNA sequene of a copy of repeat in a context-complient manner, first you have to edit data in a spreadsheet as shown below (This format of data is exported in the log window when you run GenoFinisher). In this example there are three rows each representing a gap. The contexts are highlighted in green. Note that contigs to be analyzed are set with direction (+ or -), and a empty cells separate them from their context.
Then, copy and paste the data in the top text field in the tab named "batch", and press the start button.
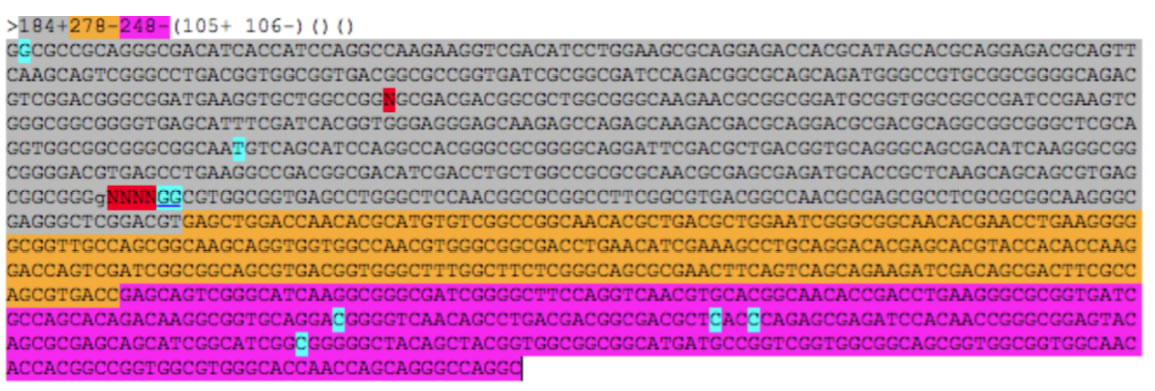
Results are shown in the multi FASTA format, and the DNA sequence is marked with colors that indicate the origin of the sequence. In the sequence, the bases different from the consensus repeat sequence are highlighted under cyan backgrounds, and Ns representing conflicting positions for which context-dependent determination was not possible are highlighted under red backgrounds. As this automated determination is done in a strict standerd, it is often possible to determine precise DNA sequence by manual inspection.
Appearance
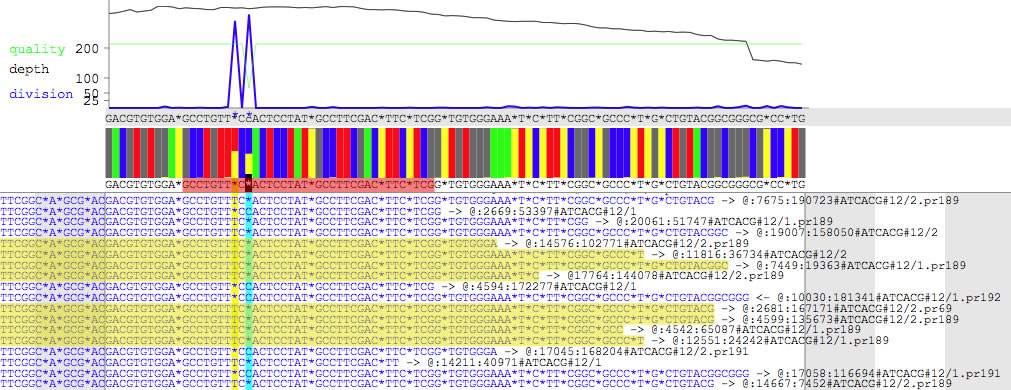
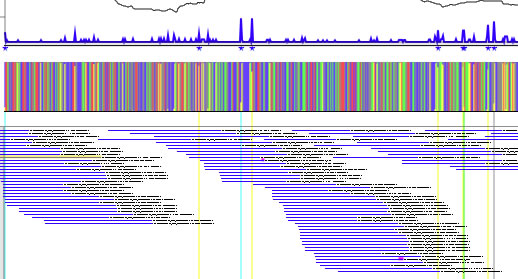
There are two panels. The upper panel shows quality scores (green line), depths (red line), compositions of non-consensus bases (blue line), compositions of bases (colored bars), contig DNA sequence (shown above the colored bars), and consensus DNA sequence made from reads currently being displayed (shown under the colored bars, and incongruent bases highlighted in black). While you hover the pointer over the contig DNA sequence, position of the base as well as the padded position are shown. Selecting the consensus DNA sequence copies the selected bases to the clip board (press option key during selection to remove *). The lower panel shows reads. Each read is rebelled with a direction (-> or <-), and a read ID. Positions of contigs are highlighted (here yellow and cyan vertical lines) where a fraction of reads does not coincide with the contig DNA sequence. Reads can be selected, and selected reads are shown under yellow backgrounds, and the number of reads being selected is displayed. Each read has a context menu (see below), and is double-clickable for copying the DNA sequence.
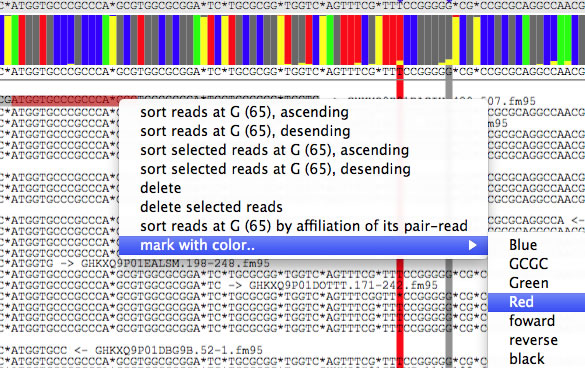
A moiety of reads that is extruding the contig is colored based on the name of contig to which the extruding part belongs. When you hover the pointer on the colored moiety, contig number is displayed (see the top left corner). Press command + K to change the string-to-color relationship. Reads can be sorted based on the name of contig to which the extruding part belongs.
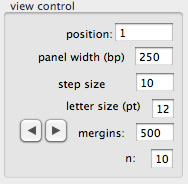
View control
The view shows a range of contig, and the size of the range is 250 base as a default value. To change the range to show, press left or right buttons, or simply set a start position. The text box labeled "margins" is to set a width of left and right margins in Pt. The value (10 in the figure) set in the text box labeled with "n" is used to judge whether a base is conflicting. If n is 10, 1/10 of reads carrying a base inconsistent with the contig sequence indicates confliction.
Filtering reads
There are several ways to filter reads to be displayed. There are check boxes to validate filters.
(1) By the prefix of read ID. For example, illumina and 454 reads can be discriminated by setting a prefix (or space-delimited prefixes).
![]()
(2) By partial match to read ID. For example, reads with ID containing "_left" or pr172 can be shown.
![]()
(3) By the direction of a Read.
![]()
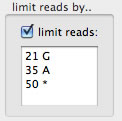
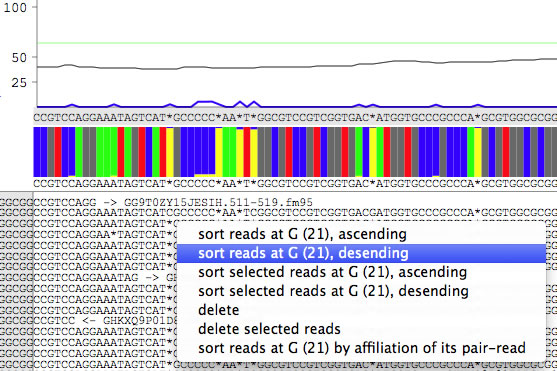
(4) By contig positions and nucleotides. By setting "21 G", for example, reads whose base at a contig position "21" equals to "G" are shown. (21 is a padded position). Multiple sets of a position and a base can be set simultaneously.
(5) By whether or not its pair read belongs to another contig.
![]()
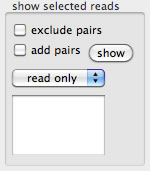
Exporting reads
Selected reads can be exported. There are several options to exclude pairs from selection, to include mate read of selected reads, and etc. It is also possible to export a read together with its mate that belongs to another contig.
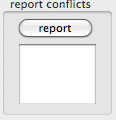
Reporting conflicts
All conflicting positions of a contig are reported, with the composition of bases that are to be displayed under the current filtering conditions.The string data are for spreadsheets.
Marking reads
Parts of read can be marked by colors, based on color-string and DNA sequence (tab-delimited) specified in the text field. You can omit the color-string. When the pointer hover over a colored part, name of the color is shown.
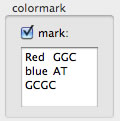
You can also double click a read, select a part of read to be colored, and select a color-string from the "mark with color.." submenu.
Arranging reads
The "turn back" check box determines how reads are displayed. If a single read is selected, such read can be moved by up or down arrow key (not recommended when the turn-back switch is ON).
"turn back" check box 'ON'.
Sorting reads
Each read has a context menu to sort reads. The menu differs depending on the base from which you open the menu. When you are selecting reads, the sort action can be operated on the selected reads.
It is possible to sort reads based on the extruding part of reads.

It is possible to 'float' or 'sink' reads that have a specified DNA sequence.
String-to-color relationship
Press command + K to open the setting window. Any string can be used as a key, including "red", "GA*TTC*", and "contig00320".
How to find variations among copies of a repeat
The following descriptions are based on the test data 1 and 2.
Here is a repeat contig, contig81, and there seems to be two copies of it in a genome.
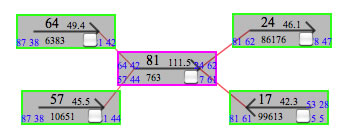
Open a viewer, and set 81 to load contig81.
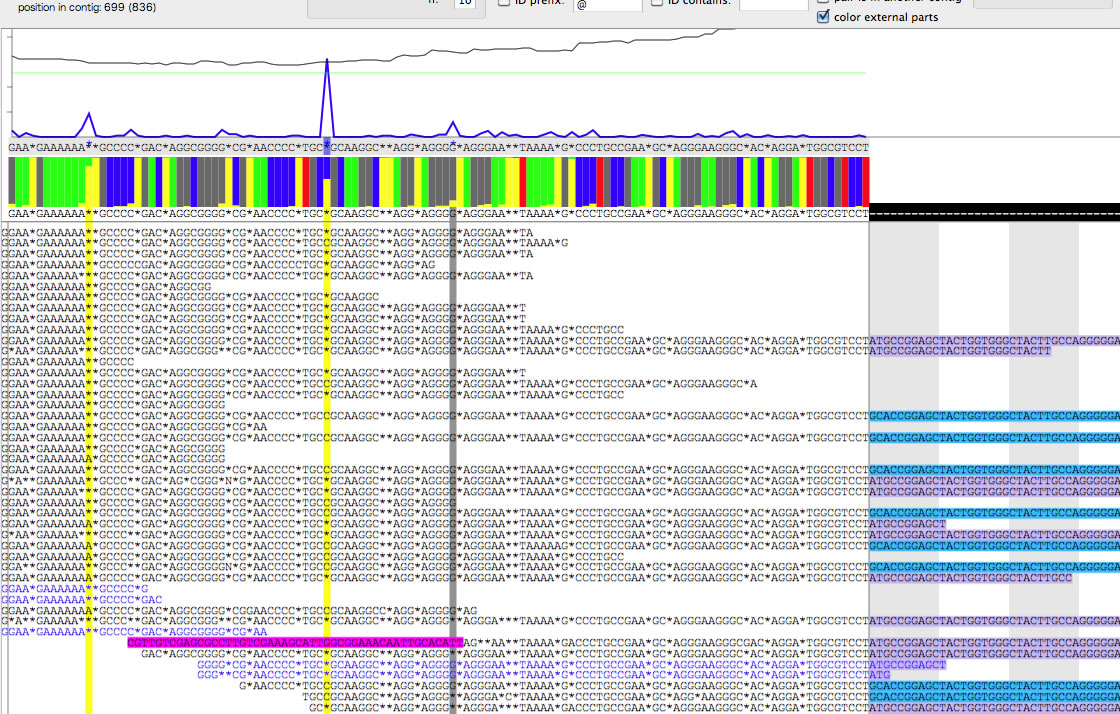
Using the right arrow, navigate through the contig81, then you will find a sharp peak of blue line at the position 699.
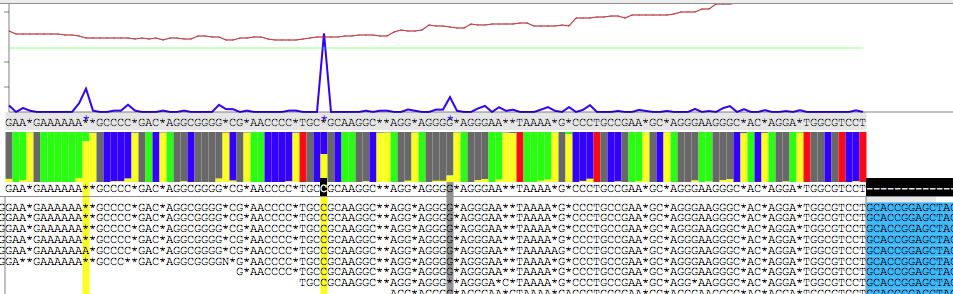
Set '24-' or '17+' as a context and then press "set context", and then check "validate".
This is what you see when you set '24-'.
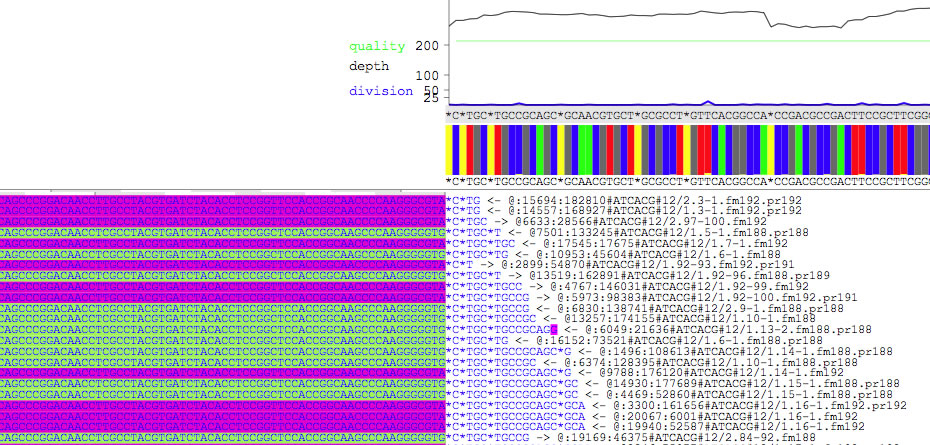
This is what you see when you set '17+'.
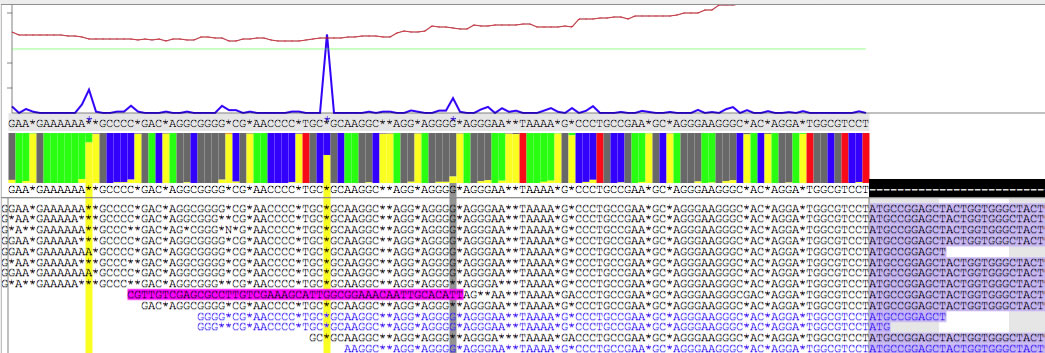
As you see in the two images, the base below the blue peak is different ( 'C' VS '*'). In this way you can find hidden variation bases, and determine context-dependent DNA sequence of a copy of a repeat. Also note that extruding parts of read are colored differently.
Distance distributions
In the tab named "gap", you can examine the distance distribution of mate pairs. By analyzing a relatively large contig, you can get basic information about the distance distribution of the mate pairs. Then, you can analyze the distance distribution of the mate pairs that bridge a gap, to infer the length of the gap (often ends of gap-flanking contigs are found to be overlapping).