|
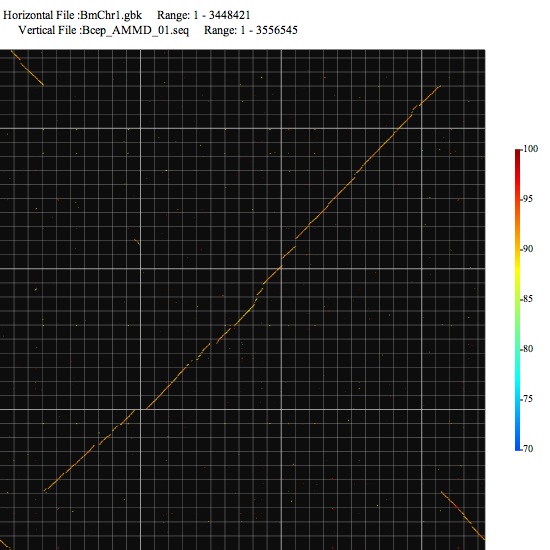
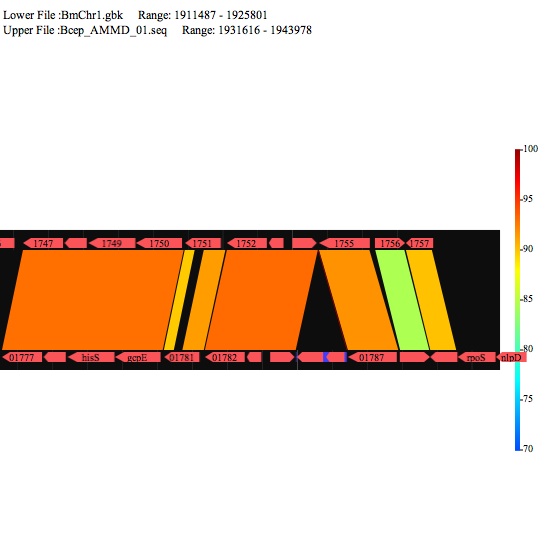
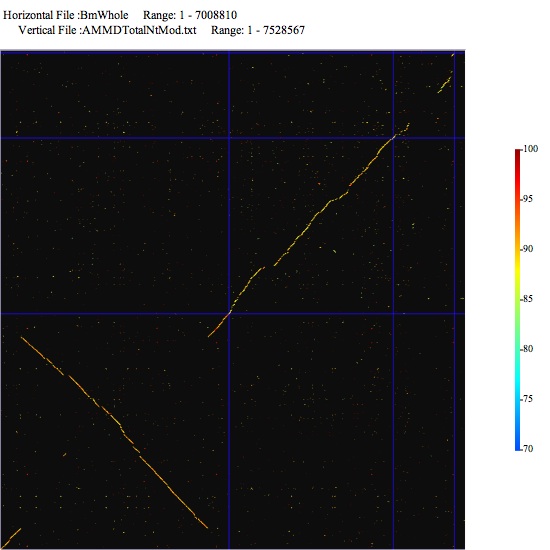
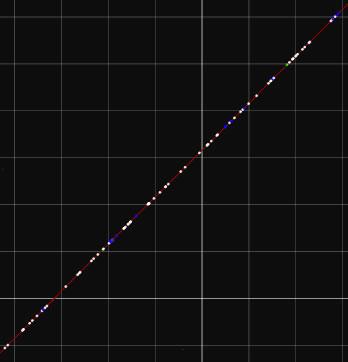
Image 1 You can click-and-drag on the image to specify the next compariosn range. The color scale on the right indicates relation between color and nucleotide identity. The left-bottom point is the origin of drawing.
 |
|
Image 2
|
|
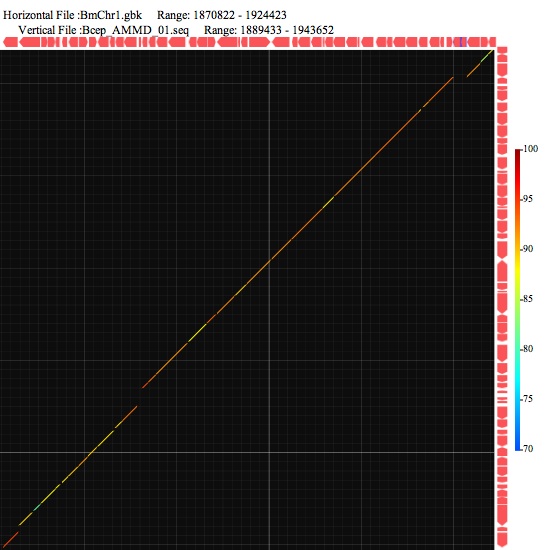
Image 3
|
|
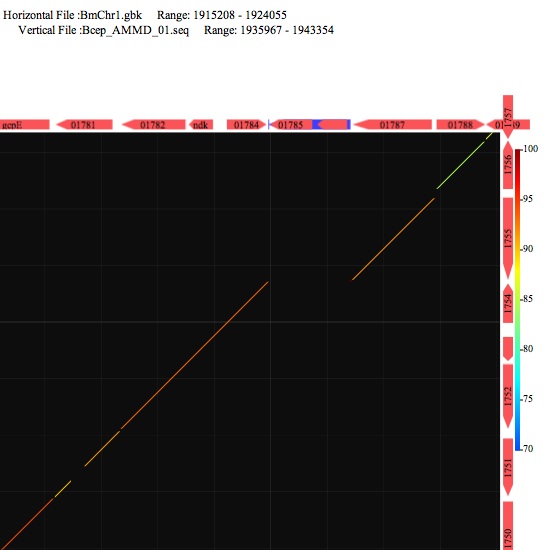
Image 4 Click the symbols around the image to see annotation. Those represent gene or other features.
|
|
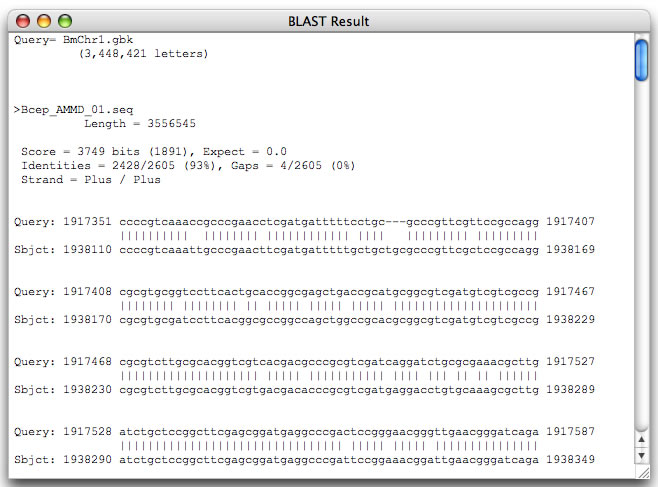
Image 5 You can view the alignment of the selected range.
|
|
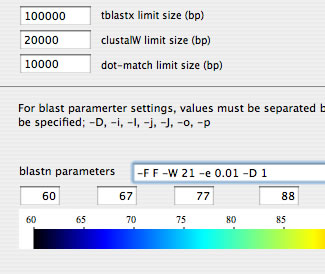
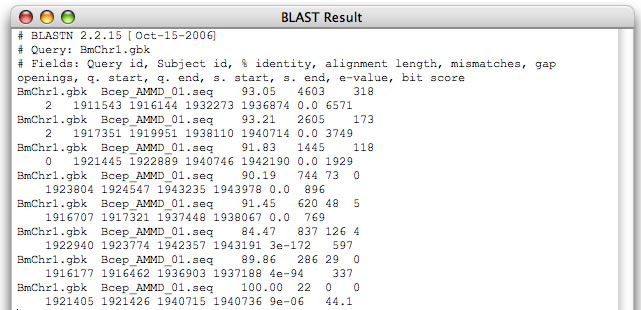
Image 6 Blastn result can be obtained by setting "1" for "-D" option in the blastn setting text box (pasting the result into a spreadsheet is recommended).
|
|
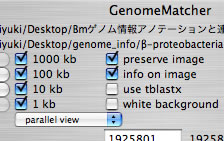
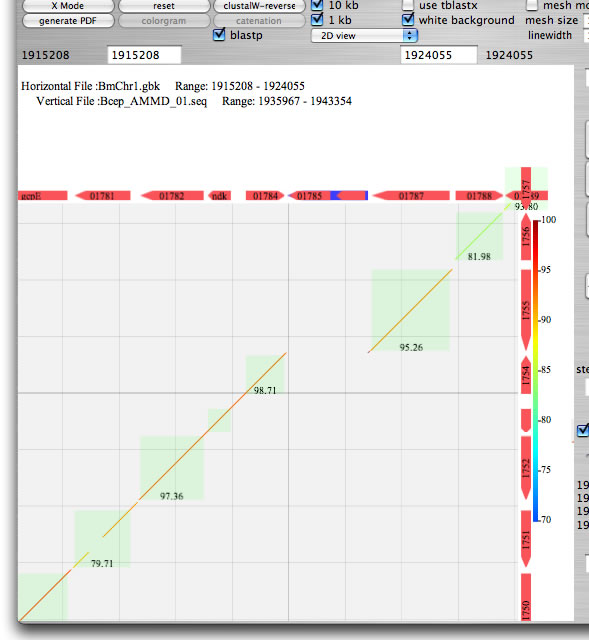
Image 7 Select "parallel view" mode to see the image of two DNA sequences aligned in parallel. The lower sequence is that placed on the x-axis. You can select a specific range by click-and-drag.
|
|
Image 8 Select the checkbox "blastp" to execute reciprocal blastp comparison. The result will be displayed as a light green rectangle with a percent identity.
|
|
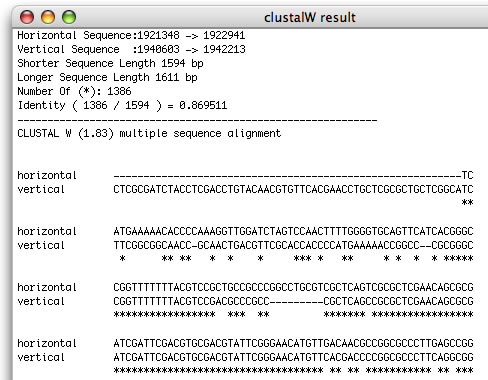
Image 9 You can obtain a clustalW result of sequence comparison.
|
|
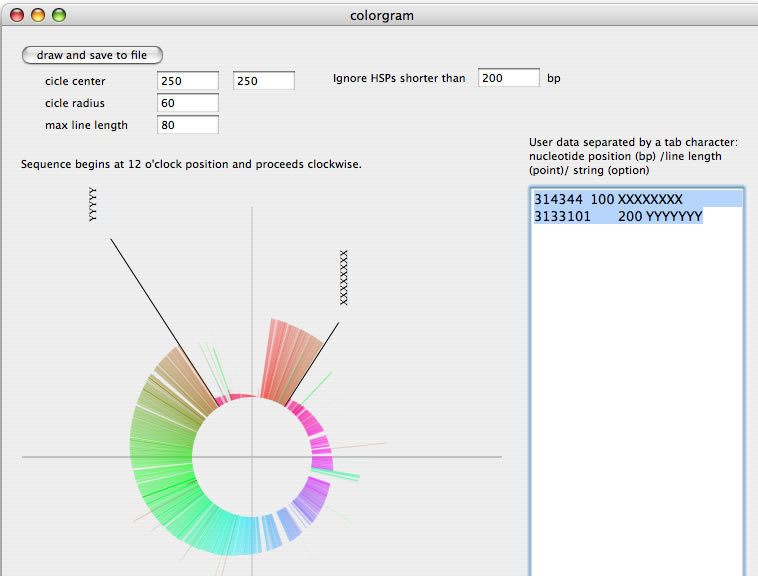
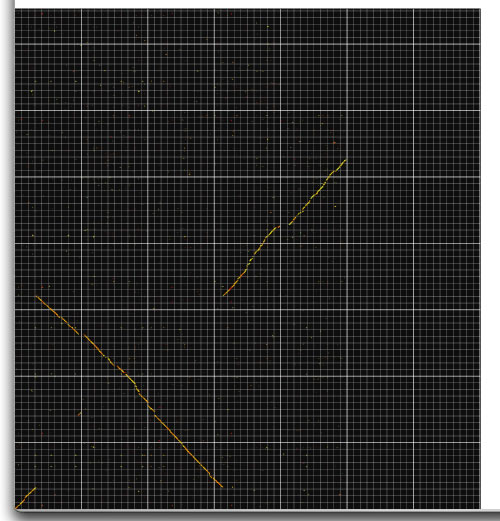
Image 10 A colorgram drawing. You can redraw a new image after changing parameters. You can add lines and strings by placing values in the right text box.
|
|
Image 11 Comparison of multireplicons. Lines are placed according to the data you set in the setting window. (You have to prepare two concatenated sequences).
|
|
Image 12 Mesh mode in progress (1 Mb mesh size). You can compare two large sequences by using "mesh mode".
|
|
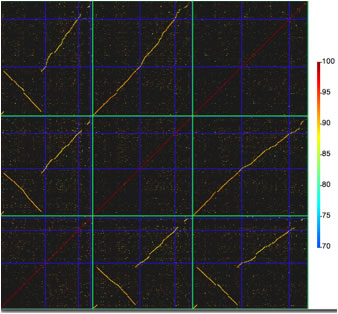
Image 13 Comparison of genomes. Note that each genome is comprised of multiple replicons. These lines that delineate genomes (green lines) and replicons (blue lines) are placed automotically accoridng to your numerical data.
|
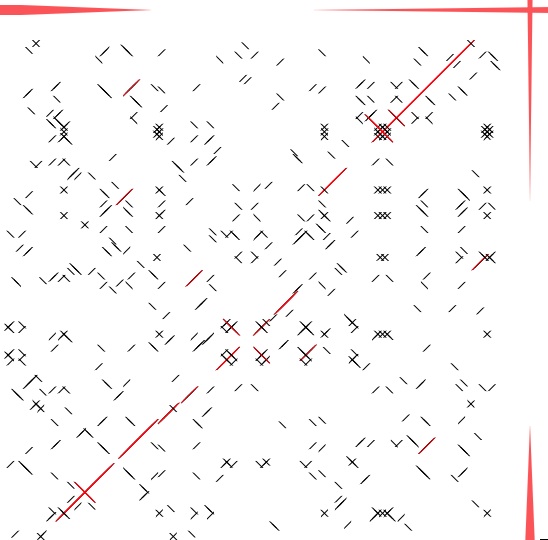
Image 14 A Dot-match image. Click-and-drag to specify the next comparison range by dragging. To undo, press command + Z. You can open a copy of the comparison window, which help you to view subregions at the same time.
|
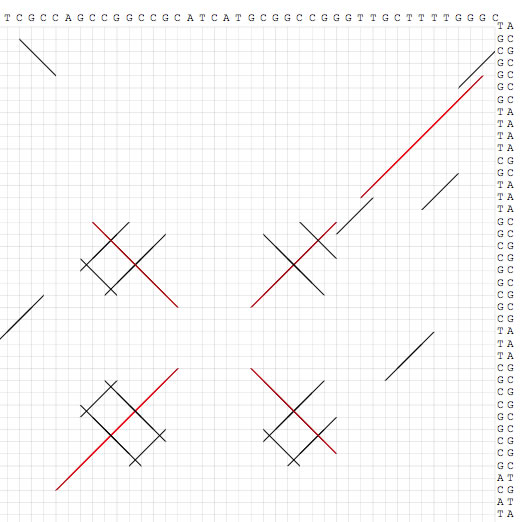
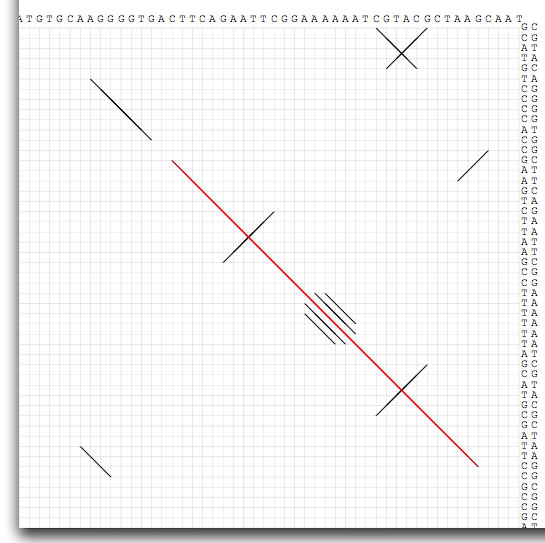
Image 15 When the comparison size is shorter than 100 bp, nucleotide sequences appear.
|
Image 16 Dot-match is a powerful tool to identify repetitive sequences that are associated with, for example, insertion sequences, transposons, transcriptional terminaters, origin of replications, binding sites for DNA binding proteins, CRISPRs, and integrons. For this purpose, you should compare a sequence to itself. This image shows 38-bp terminal inverted repeats of a Tn3-type transposon.
|
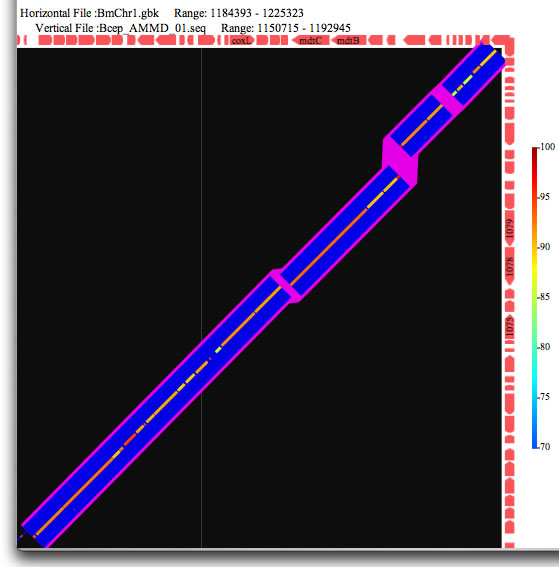
Image 17 Synteny analysis. The gaps larger than the threshold are highlighted in purple.
|
|
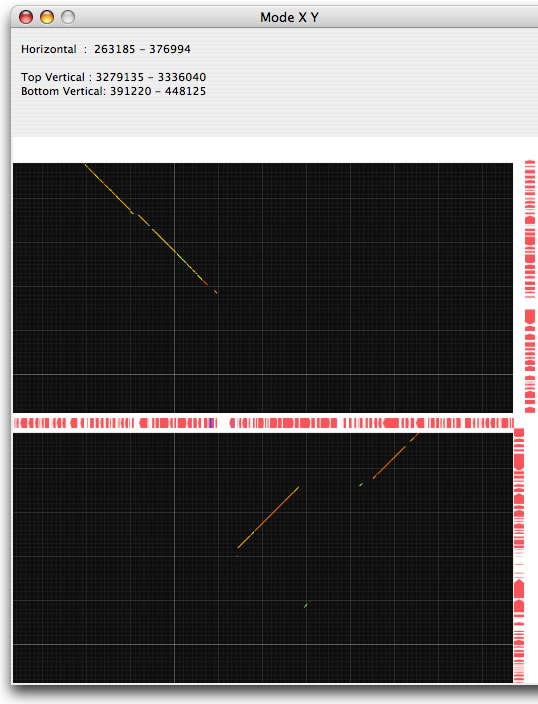
Image 18 Y mode result. By using Y mode, you can see the separate two regions close to each other. By using this mode, the sites for recombination could easily be analysed.
|
|
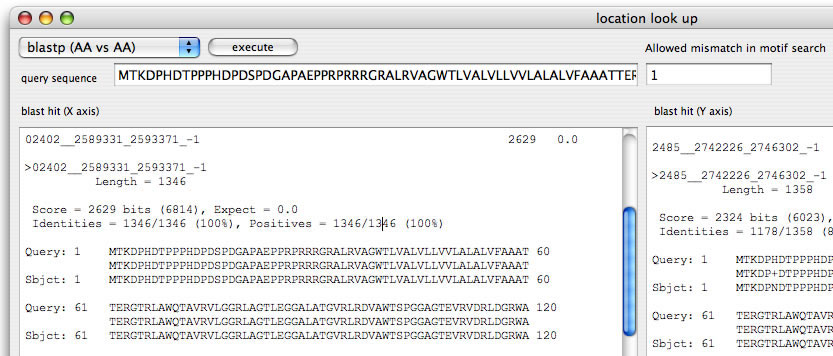
Image 19 Location lookup. You can search against the two sequences (that are place in x- and y axis) by blast analyses. Input the query (both DNA and AA are accepted), select a program, and click "excecute" (To open this window, select "location look up" in the "Analysis" menu). In order to change the parameters, edit values in blast setting window (command + B).
|
|
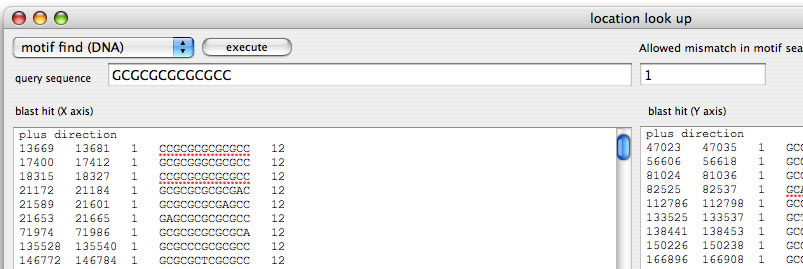
Image 20 Motif search function. For this image, one mismatch was allowed. The motif is searched for both sequences (x and y) in both strands (To open this window, select "location look up" in the "Analysis" menu).
|
|
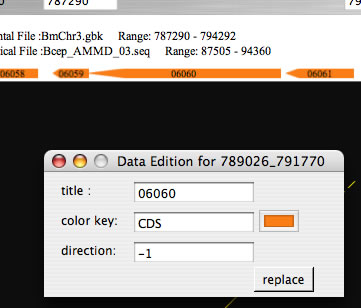
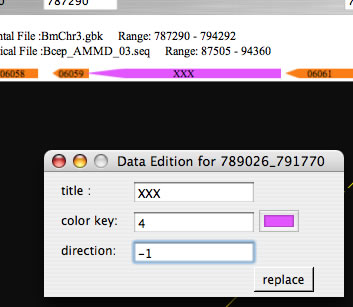
Image 21Click gene symbols while pressing command key to open a window for editing the title or color of the gene symbols. Press the replace button to reflect changes.
|
|
Image 22 The SNPs detected by MUMmer program is graphically presented. Indels are shown in blue, transitions in white, transversions in green.
|
|
Image 23 Result from blastp comparison. Each oval represents blastp hit. You can also search every CDS on x-axis against DNA sequence in the y-axis by tblastn (and also the opposite).
|
|
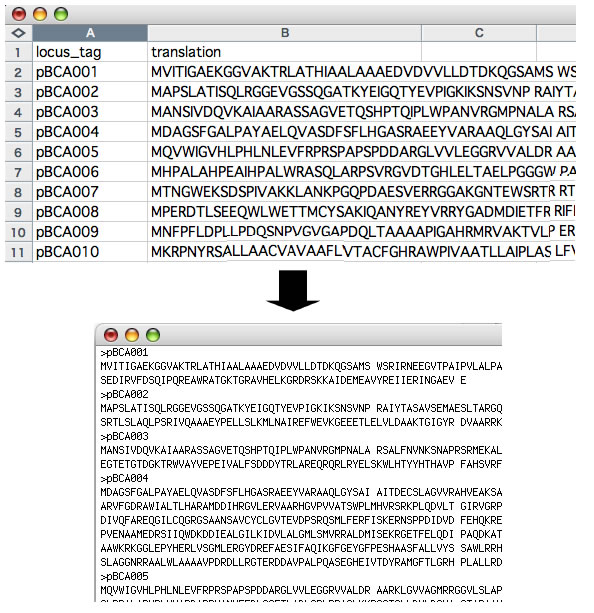
Image 24 A function of StringFormatter to transform data that are "one-entry per one-row" to FASTA format.
|
|
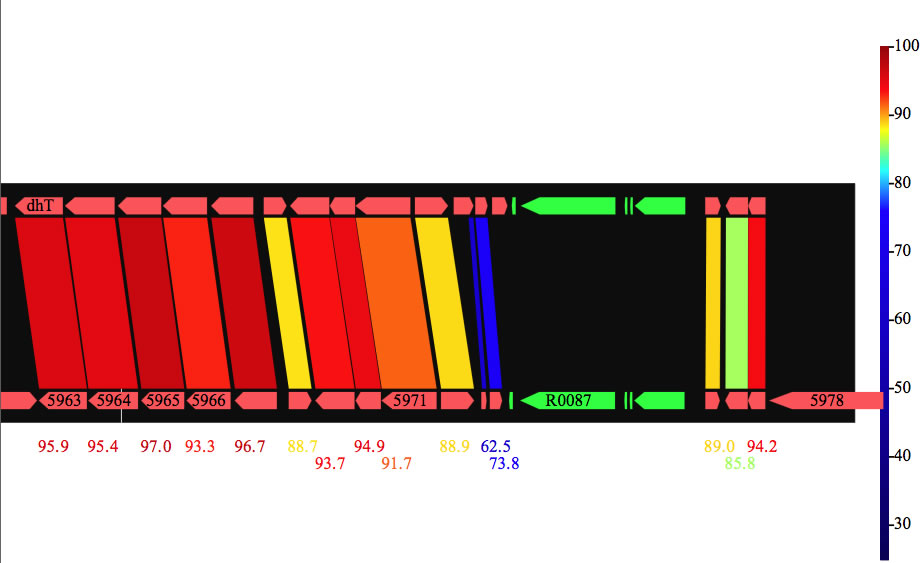
Image 25 Result of blastp comparison between CDSs. Numbers represent identity(%). You can also write the result in a PDF file.
|
|
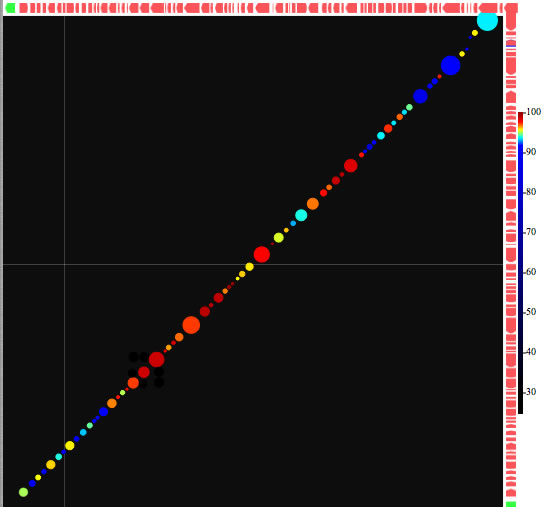
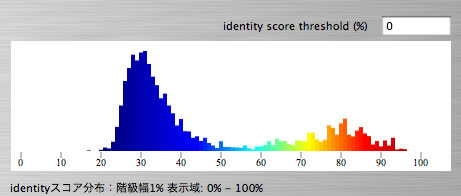
Image 26 Distribution of lengths of tblastx hits as a function of identity score. By setting a threshold identity score you can hide hits with identity score lower than the threshold. You can reffer to the distribution data by control + click.
|
|
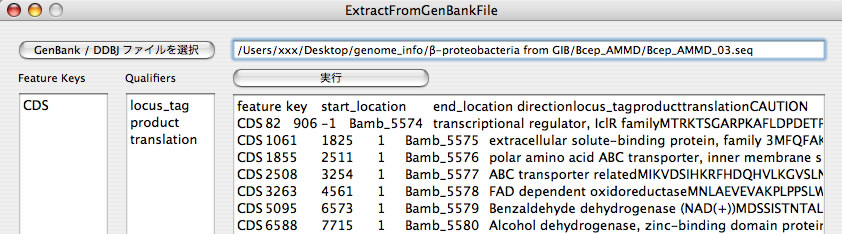
Image 27 Result of ExtractFromGenBankFile. Data in GenBank format are transformed into a format that is more suitable to handle in a spreadsheet. You can edit "Feature Keys" and "Qualifiers" text fields.
|