Contents
- Preface
- Overview of GenomeMatcher
- How to run GenomeMatcher: A tutorial
- Tips
- Accepted DNA sequence
- How to input your own annotation data
- How to set key to color relation
- How to edit color scale
- Parallel view
- Base-to-base alignment
- X mode and Y mode
- Synteny analysis
- Comparison of concatenated sequences
- Dot match analysis
- How to change color of gene symbols
- Search against input sequence
- Reciprocal comparison by blastp
- Colorgram
- How to save images
- Troubleshooting
- known bugs
- movie Downloads
- Q and A
- Contact information and License
Links
Thank you for using GenomeMatcher. Before reading the main text, please read the followings.
- Most of the GUI features in GenomeMatcher display a hint when you hover the mouse pointer over them.
- A visual gallery of GenomeMatcher with brief explanations is here.
- Some movie tutorials on the basic usage of GenomeMatcher are available here (an older version).
- Please download the latest version of GenomeMatcher. here.
- GenomeMatcher runs in MacOS10.3 or higher.
- FAQs are available (here).
- When you encounter problems, please refer to the tips for trouble shooting. Any comments, suggestions and bug reports are welcome.
GenomeMatcher is a tool for visualizing similarities between two DNA sequences. GenomeMatcher was originally built as a graphical user interface for bl2seq, a variant of BLAST program, and has been tuned up and extended to meet other requirements.
It visualizes results from bl2seq (blastn or tblastx) and MUMmer (nucmer or promer) and allows you to examine the differences in genomic difference in detail. The visualized image is either in two view modes. In one mode two sequences are orthogonally-placed and in the other mode they are placed in parallel. In either mode sequence similarities are displayed in colors so that you can see the distribution of similarity scores across the DNA sequences that are under examination.
Once a comparison image is generated, you can specify subranges by dragging or entering values from key board and re-compute the comparison. You can also obtain base-to-base alignment of ClustalW, MUMmer, MAFFT, and bl2seq.
While examining the genomic differences you can refer to the annotation data by clicking symbols that appear along the comparison image. Thus you can relate the differences to the annotation data.
You can compare very long sequences ( >300 Mb, for example) by using a mode named 'mesh mode', in which sequences are divided into smaller parts and results of reciprocal comparisons are assembled into completion. In a mode named 'catenation mode' you can compare concatenated sequences in a replicon by replicon fashion. Using this mode, for example, 10 multi-replicon genomes can be compared replicon by replicon.
GenomeMatcher is also good for drawing genes or operons. By editing annotation data in a spreadsheet, you can input annotation into GenomeMatcher and obtain a relevant image. Images saved in PDF formats are vector-formatted and can easily be edited using graphic softwares.
How to run GenomeMatcher: A tutorial
By following the steps described below, you learn the basics of using GenomeMatcher.
Download the following two files. The data files were originally downloaded from a website of Genome Information Broker service of DNA Data Bank of Japan (DDBJ) (http://gib.genes.nig.ac.jp/) on March 31 2008. (From this web page, you can download complete genomic sequences very easily.)
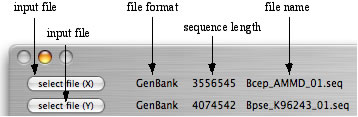
Load the GenomeMatcher with two sequence files. Use two buttons at the left-up corner of the main window, which are entitled "select file(X)" and "select file (Y)". If the sequences are loaded successfully, type of loaded sequence, length of nucleotide, and name of file are displayed.
Step2: Execute bl2seq and obtaining a graphical result
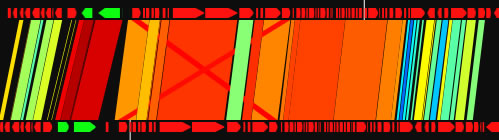
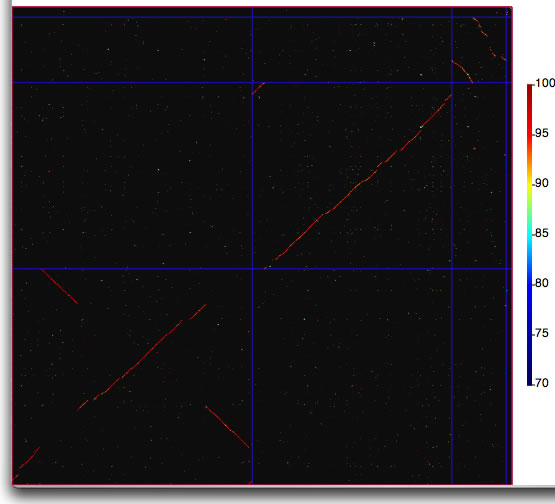
Click the button entitled "compare", and wait for several seconds until bl2seq finishes and comparison image is displayed. The left-bottom part of image is the origin of drawing (the first base positions of the two sequences are here). The color of each line indicates identity score of blastn comparison. The color scale placed at the right shows the relation between the score and color. You can edit the color scale in the setting window, which opens by pressing command + B.
![]()
Color scale rotated for 90 degree.
Step3: Select ranges for further comparison.
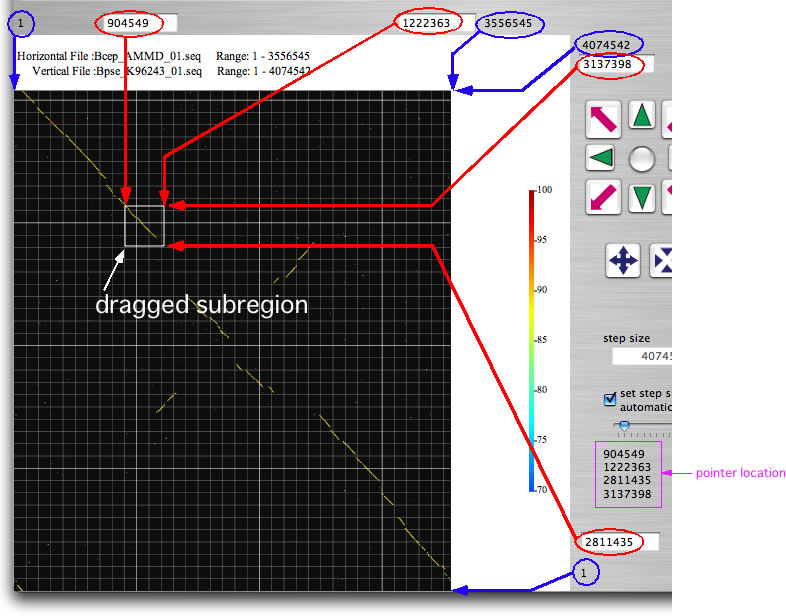
Drag the mouse over any part of the image to select a subregion. The ranges for the further analysis are displayed in the four text boxes (indicated by red arrows). You can also enter the location by keyboard. Once you select a subregion, execute bl2seq as you just did. Try eight navigation buttons that upon click change analysis range and execute bl2seq. The step size of the movement by navigation buttons is shown in the 'step size' text box. You can change the analysis range by dragging the image while pressing the shift key. If the longer sequence length of the present displaying ranges is below a threshold value (you can change the threshold; press command +B), gene symbols will appear , which upon click shows relevant annotation data. By selecting one of 'See Annotation' subitems in 'Analysis' menu, you can refer to the annotation data within the displayed ranges in one of two formats. One is the canonical DDBJ/GenBank format and the other is a format suitable for viewing and editing values on a spread sheet (copy and past it onto a spread sheet). The latter format is nearly equal to that accepted by GenomeMatcher for inputting user annotation data.
Step4: Change the appearance of the drawing
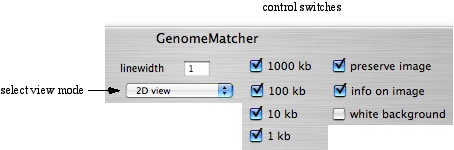
You can change the appearance of the images by checking or uncheking the control switches right above the main window. Try some of the control switches. Try also to change '2D view' to either 'parallel view' or 'parallel view (flip)' and execute comparison. In these view modes, the lower sequence corresponds to the x-axis.
There are two ways to save images. You can save the image that is now displaying in the main window in TIFF, PNG, or JPEG format, by selecting "Save Image in the main window" from the menu. Alternatively, you can re-analyze under the present setting and export the resulting image to a PDF file. The image in the PDF file is vector-formatted and you can edit it easily by using graphic softwares.
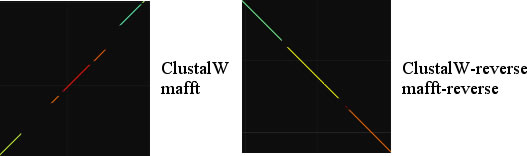
You can obtain a base-to-base alignment of DNA sequences that are within the selected ranges. You start the program by choosing one program in the pop-up button, and the resulting alignments are displayed. In case using bl2seq and MUMmer, the direction of the sequences dose not matter, however, when using MAFFT and ClustalW you have to choose appropriate item (see the two pictures shown below). There are size limits for the analysis of MAFFT and ClustalW (press command + B to see and change the limits).
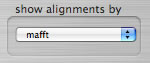 pop-up button
- Select subranges to be compared and click the button entitled 'dotmatch'. If the button is grayed-out, it could be because too long range is selected (press command + B to see and change the limit).
- You can set two threshold values. Exact matches longer than the first threshold value are shown in black and those longer than the second in red.
- The analysis lengths in DotMatch are always equal to each other (you always see results in a square).
- You can undo by pressing command + Z.
- When the analysis length is less than 100 bp, bases are displayed.
- Accepted DNA sequence
- How to input your own annotation data
- How to set key to color relation
- How to edit color scale
- Parallel view
- Base-to-base alignment
- X mode and Y mode
- Synteny analysis
- Comparison of concatenated sequences
- Dot match analysis
- How to change color of gene symbol
- Search against input sequence
- Reciprocal comparison by blastp
- Colorgram
- How to save images
GenomeMatcher reads DNA sequences from files. Accepted formats are:
- DDBJ / GenBank format that contains only one "ORIGIN" signature ahead of DNA sequence data.
- FASTA format (no multi-FASTA format).
- text format.
How to input your own annotation data
You can load the software with your own annotation data (press command + M to open a dedicated window). If a sequence is already has annotation, new inputs are added to them. In order to remove existing annotation, click the button entitled 'Remove all entries'. Your data must be properly edited to meet the requirements.
Before reading through, please see the images you find bellow, you will realize what the data format looks like. One entry (each row corresponds to one entry) is consisting of seven values that are separated from each other by a single tab character. Those seven values are: i) start and ii) end locations of the entry, iii) direction (1 or 0 or -1, 0 indicates no directional attribute), iv) any strings you want to see when you click on the gene symbol, v) feature key that conform to DDBJ / GenBank format, vi) any string that will appear on the gene symbol, and vii) a color key (any string). Note that start position is always smaller than the end position. The first four values are essential and the later three are optional. The entries must be separated from each other by a new line character. The seventh value is a string that indicates a color. You can download sample annotation data, edited in a spread sheet (You can download its parental annotation data from here).
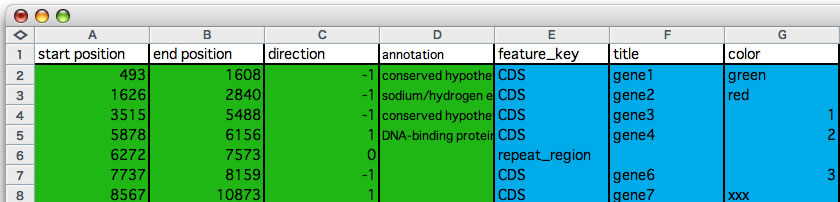
An example of editing annotation information. Copy the colored cells and paste into the annotation input field that opens by pressing command + M. At least the first 4 columns (green) are required (column D may be empty).
How to set key to color relation
You can see and edit the string-to-color (press command + K to open the setting window) relation (we call this relation also as key-to-color relation). In this setting window every string must be unique among the all keys (you can not add a non-unique key). The color cell you find upper-right position defines default color, which is used when a string that is absent from the color-to-key relation table was used.
The six values determine the color schale.
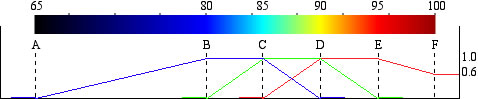
Tips to edit the color scale. Six values (e.g., 65, 80, 85, 90, 95, and 100 ) are used to determine the color composition of red, green, and blue.
When the view mode switch is at "parallel view" or "parallel view (flip)" position, two sequences are arranged in parallel. The lower sequence is that placed on x-axis, and upper sequence is that placed on y -axis in 2D view mode. In "parallel view" mode, the starting locations of the both sequences are at the left, whereas in "parallel view (flip)" mode, the starting location of the upper sequence is at the right.
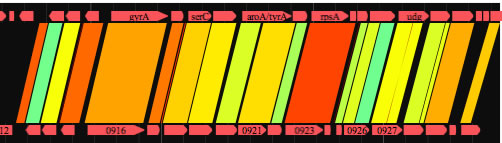
Examples of the "parallel view. The bottom image was generated by using both parallel mode and the catenation mode.
You can obtain base-to-base alignment. See a tutorial section.
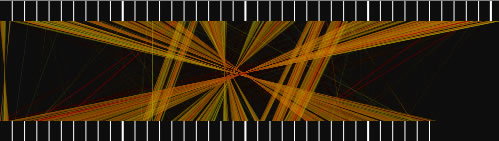
Two modes, called X and Y , are implemented to view two horizontally or vertically separated areas in a close context. When you choose one of these modes, you can select an area of interest by dragging and this will generate a half-square rectangle. By clicking on the image, another half-square rectangle will appear that moves horizontally or vertically (depending on the mode you have chosen), until you stop dragging. The two specified areas are compared and displayed in another window.
Invoking the X mode. Two half-square rectangles determine the areas to be analyzed.
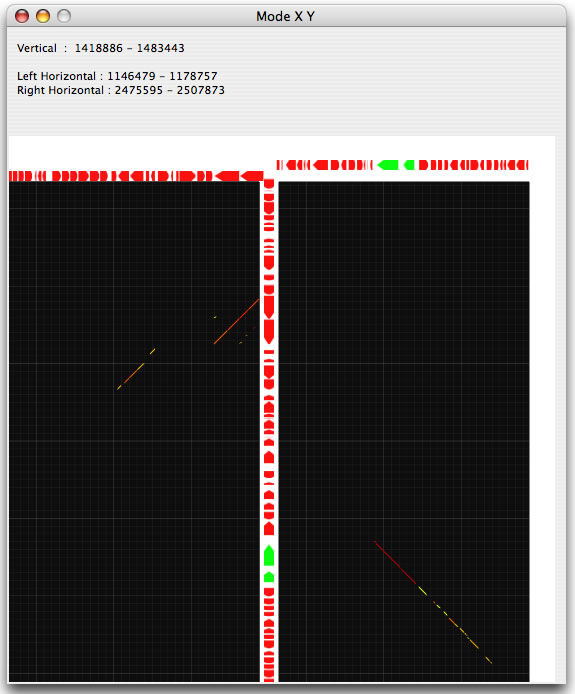
Example of an X mode result.
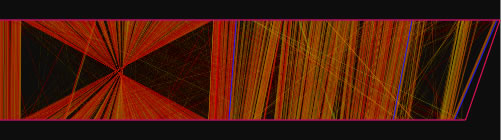
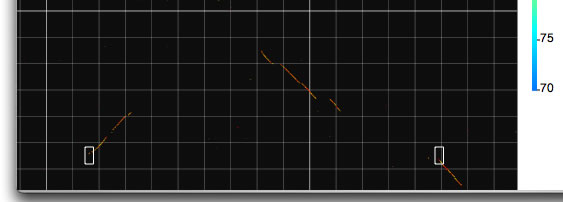
GenomeMatcher also implements a function to extract, in a text-based representation, the locations of a DNA region where the order of HSPs is preserved between two genomes. When the control check box for synteny analysis is on, GenomeMatcher tries to connect HSPs that are close to each other, according to the level of sensitivity you specify. A unit of connected HSPs is called a cHSP. cHSPs are shown above thicker blue lines. GenomeMatcher also tries to connect cHSPs under a different threshold value (a fixed value; 20 kb), and connected cHSPs (ccHSPs) are shown by thicker light-purple lines. The result of the connection is also given in a text-based representation, which shows the location of each ccHSP and cHSPs that consist of a ccHSP. Although GenomeMatcher’s synteny analysis algorithm may fail to connect or may connect inappropriate HSPs, you can check the accuracy of a connection by examining the given image.
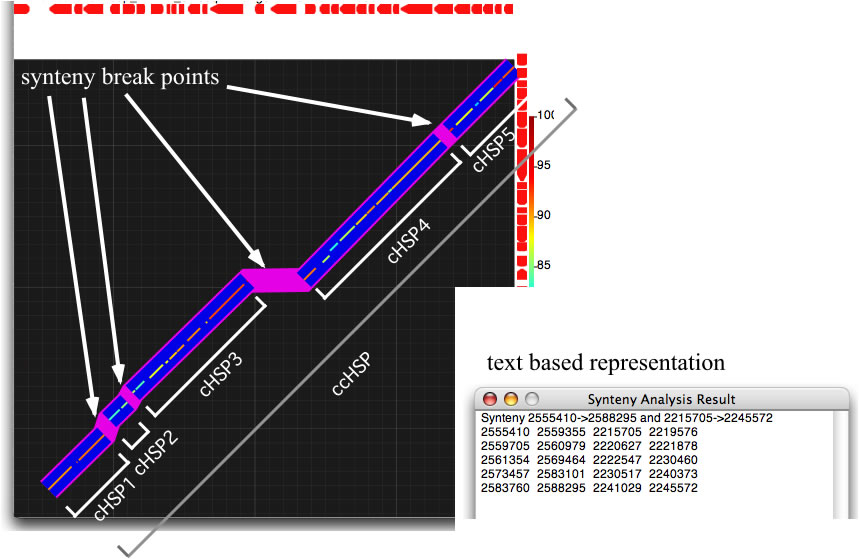
GenomeMatcher synteny analysis. Synteny break points are highlighted as purple line segments. See below how to interpret the text-based representation.
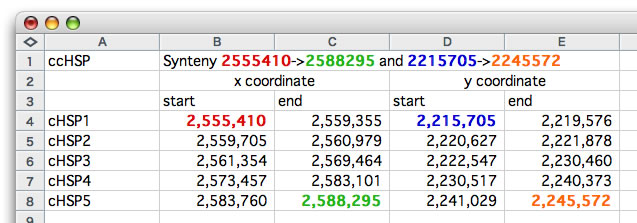
How to interpret the text-based representation. The relevant values are colored.
Comparison of concatenated sequences
Some bacteria have genomes consisting of more than one replicon. To compare two multi-replicon genomes, it is easier to first create a concatenated sequence for both genomes and compare them. However, the concatenation generates a DNA sequence that is artificial at the junction point. Thus, a replicon-by-replicon comparison is more suitable. When using "catenation mode", you specify the sizes of the replicons used to generate both concatenated sequences. Each comparison result is bounded by a rectangle.
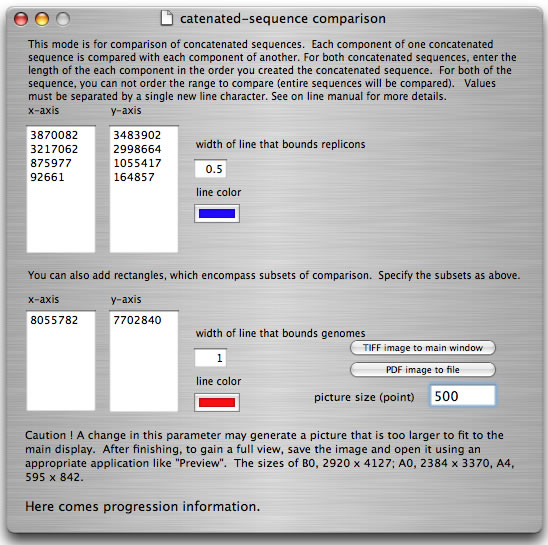
How to launch catenation mode. Suppose that you have two concatenated sequences consisting of four replicons with sizes 3,870,082 bp, 3,217,062 bp, 875,977 bp, and 92,661 bp (total 8,055,872 bp), and four replicons with sizes 3,483,902 bp, 2,998,664 bp, 1,055,417 bp, and 164,857 bp (total 7,702,840 bp). In the main window, you load two files containing sequences with sizes 8,055,782 bp and 7,702,840 bp, respectively. In the setting window, enter the sizes of replicons as shown and press the "run" button.
Comparison image produced in catenation mode. The boundaries of replicons are marked by lines with the color specified in the setting window.
This mode is also applicable to a reciprocal comparison of multiple genomes. If you desire, you can add genome boundaries to discriminate one genome from another. To do this, in the setting window set two text boxes with the sizes of the genomes. Following are examples of settings for a comparison to itself of a concatenated sequence of three genomes (in this order) from Burkholderia cenocepacia J2315 (four replicons, 3,870,082 bp, 3,217,062 bp, 875,977 bp, and 92,661 bp; total 8,055,782 bp), B. pseudomallei K96243 (two replicons, 4,074,542 bp, 3,173,005 bp; total 7,247,547 bp), and B. xenovorans LB400 (three replicons, 4,895,836 bp, 3,363,523 bp, 1,471,779 bp; total 9,731,138 bp).
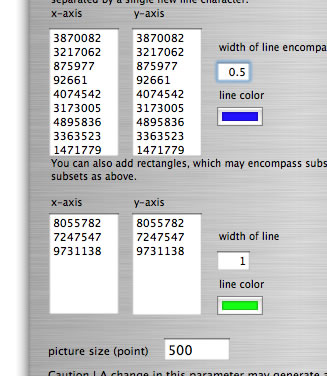
Setting for comparison of a concatenated sequence of genomes to itself.
You can generate a larger version of the comparison image by setting the picture size, for example 2300 points for an A0-size image. However, most of the dynamic scheme of GenomeMatcher is not valid in the larger image.
To start running the dot-match program from the main comparison window, the sequence ranges that are set for comparison must be shorter than 10 kb, but you can expand the range after you start the dot-match program. The dot-match scheme in GenomeMatcher includes 10 features that help quick and dynamic access to the comparison.
- Two word sizes can be set; the result of one word size will be displayed in black and the other in red. This representation of the result makes it easy to discern matching regions, especially when long sequences are compared.
- Comparisons in both orientations are displayed in a single window. You can set the orientations to be compared by changing the state of the corresponding switches.
- Both sequences, as well as a complementary sequence of the vertically placed one, will appear in the text boxes, allowing easy access to the nucleotide sequences that are displayed.
- When comparing sequences up to 100 bp, symbolic characters for nucleotides (A, C, G, or T) will appear along with the grid lines.
- Dragging generates a square that determines the next range of comparison.
- ClustalW can be launched as in the main window.
- You can launch a copy of the present analysis window and run both independently. The two windows will help to identify small sequence repeats that are distantly located. Such distantly separated repeats are seen for insertion sequences or integration sites of genomic island.
- You can easily change the comparison range by clicking buttons or by manually entering start positions and a comparison length in the text boxes.
- The undo function is limitless. Press command + Z to undo.
- As in the main bl2seq comparison window, arrows or rectangles will appear and, when you click on them, will exhibit relevant annotation information if the relevant switch is “on”.
How to change the color of gene symbols
GenomeMatcher defines relationships between color and string in the key-to-color relation table. As a kye, you can use not only 'Red' or 'Green' but also '1' or 'A' or 'My favorite color'. You must specify the relationship in the key-to-color relation table (press command +K to open). You can add a new relation by pressing the 'add new' button. The key must be unique in the table (you can not enter a string that is not unique). By changing the relation you can change the color of the gene symbols.
Your query sequence (either DNA or amino acid sequence) can be homology searched against the DNA sequences that are loaded (Analysis menu→location lookup). Please select the search program from the pull-down menu. In addition to the BLAST programs, 'simple find' and 'motif find' programs are available. In the simple find function, query sequence is searched across the entire sequence including the complementary strand. In the motif find function, query sequence is searched as simple find but some mismatches are allowed (the number of mismatches allowed are specified by you). Caution : 'motif find' requires much time to finish. The time required increases as the length of query sequence and number of allowed mismatch increase.
Reciprocal comparison by blastp
With the blastp switch on, all CDSs on X axis are compared against all CDSs on Y axis by blastp (but not when the number of searches exceeds 900 by default, press command +B to change this limit). The rectangles representing 'blastp hit' will appear, which upon click shows blastp result. You can change the blastp parameter in the blast setting window (press command +B).
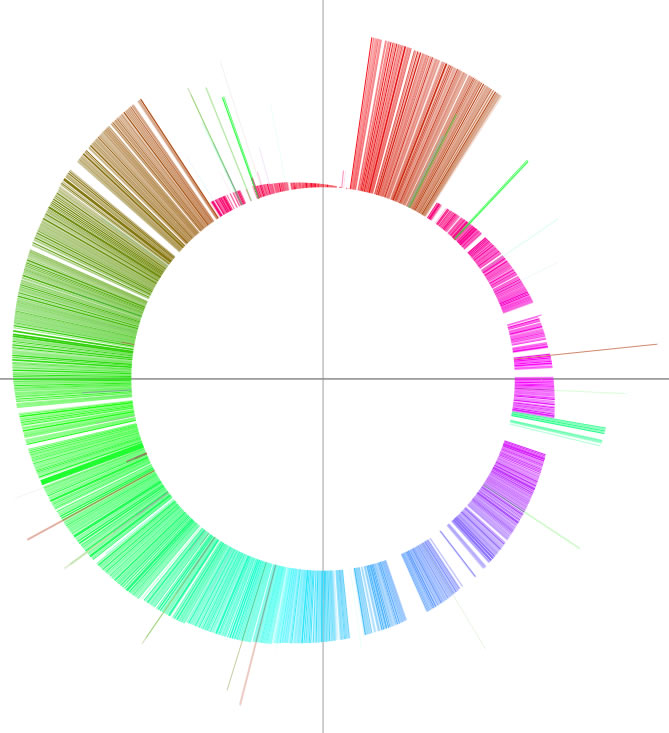
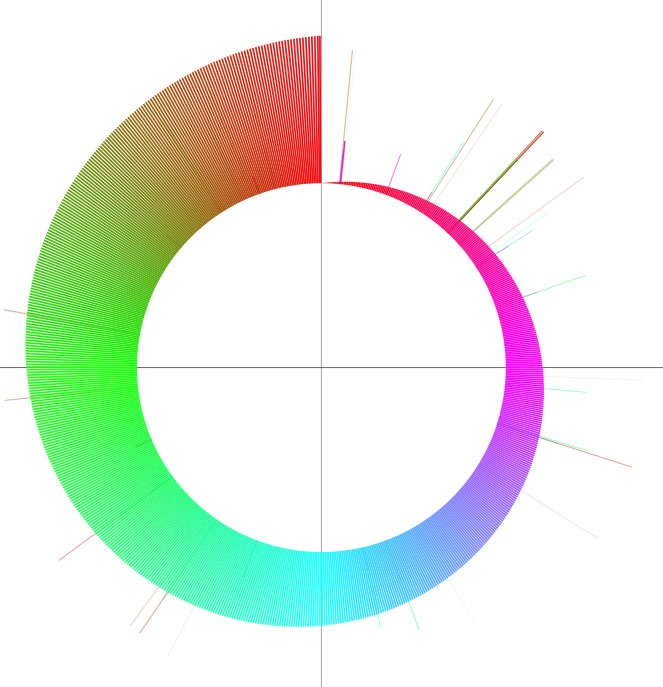
The word 'colorgram' represents a kind of drawing method, and image(s) generated by using this method are also referred to as 'colorgram(s)'. We have developed this method to visualize the differences in the topologies of two chromosomes. Click the button entitled 'colorgram' to generate a colorgram (this button is active only when the entire ranges are selected, press the 'reset' button). The sequence you loaded on the x-axis (sequence A) is placed along with a circle, starting from 0 o'clock position, in clockwise orientation. The presence of lines means that regional location in sequence A is similar to sequence B, and both the height and color of the line indicate the position in the sequence B (similarity is searched by blastn). The image on the left shows topological difference between two genomes, which can be explained by a single inversion. The colorgram shown on the right is a result of comparison of a sequence to itself. You can modify the colorgram by editing the values in the window where you see a colorgram. You can add sets of lines and strings at position you want by entering following three values, position (bp), line height (pt), and any string (optional). Each values must be separated by a tab character and each set must be separated by a new-line chracter (edit values in a spread sheet software and copy-paste the edited values). You can save the colorgram into a PDF file, click the button on the colorgram window.
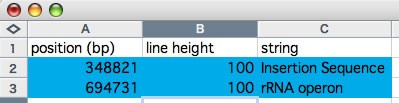
Edition of values in a spreadsheet. Copy the values on blue background and paste them into the right text box.
There are two ways to save images. In one way, you can save the image that is displaying in the main window in TIFF, PNG, or JPEG format. The other is to analyze the present setting and draw the resulting image in a PDF file. The image in the PDF file is vector formatted and you can edit it easily by using graphic softwares.
You can save the images in the image column, and you can load the saved images from file. Caution!! The size of a created file increases proportionally as the number of image increases, please delete as many images as possible before you save (press command + D to delete a image in the image column).
- tblastx analysis takes long time, especially when long sequences are compared.
- Although you can save images in the image column and can restore the images from file, the file size will be large if there are many images. Please delete unnecessary images before saving.
- In Dot-Match, you can not edit the ending positions. The ending positions are automatically calculated from the starting positions and the analysis length.
- Please remove from annotation data entries that begins in a larger number and ends in a smaller number. This could happen when a circular replicon have an annotated entry that spans position 1. For an example, circular replicon with size of 126000 bp may have an entry of CDS 125231..2304.
- Do not compare large sequences without using mesh mode.
- In OS10.5 you can not selecte image in the image column using the arrow keys on the keyboard.
- In OS10.3 and OS10.4 you may see something odd around the gene symbol.
1:Input two sequences and compare by bl2seq (3.2Mb) Two DNA sequences downloaded from GBI (with .seq file extension) are compared.
2:X mode (0.7Mb) You can examine two distantly located subregions in a closer context.
3:mesh mode (0.3Mb) mesh mode analysis with 1 Mb mesh size.
4:Changing bl2seq parameters and edition of the color scale (1.9M)
5:Dot match comparison (6.1Mb)
A:When annotated sequence was loaded, these strings represent values for 'gene' or 'locus_tag' qualifiers. When your own annotation data is in, the sixth value in the data format is shown. See here to see the user annotation data format.
A:The strings are shown if there is enough space to show. When you enter your annotation data, please remind that the sixth value should not be too long to fit.
A:When you input DDBJ/GenBank format, those data that are shown as gene symbol are data that are related to following feature keys. CDS、rRNA、tRNA、repeat_region、repeat_unit. If you want to show annotation related to other feature keys, edit the values in the window that opens by pressing command + B. The gene symbols appear only when the both displaying ranges are under a limit size (200kb by default). You can change this value.
A:Please examine the data format carefully. No space characters in the first three columns. Do not include the header from a spread sheet.
A:You have to download and install MUMmer for yourself. After installation, you have to specify the path to the MUMmer folder.
MUMmer is downloadable from http://mummer.sourceforge.net/ , and manuals for installation is here http://mummer.sourceforge.net/manual/ (see section 2.3. Compilation and installation).
After installation activate GenomeMatcher and in the setting window, which opens by pressing command + B specify the path to the folder (by default the path is '/MUMmer3.20/' and you have to do nothing).
A:You have to download and install MAFFT for yourself. After installation, you have to specify the path to the MAFFT folder.
MAFFT is downloadable from http://align.bmr.kyushu-u.ac.jp/mafft/software/macosx.html. After downloading, install Mafft using the installation package. By default, path to mafft is '/usr/local/bin/mafft'. If not, specify the path to the mafft program in the setting window that opens by pressing command + B.
No you can't, but you can draw TIFF, PNG, and JPEG images.
Contact information and License
Please send e-mail to the following address:
Please include the word "GenomeMatcher" in the subject field of the e-mail.
GenomeMatcher is provided free of charge for academic users. A license is needed for all other users. For licensing information, please send e-mail to the address given above.
When publishing figures or results produced using GenomeMatcher, you are requested to cite our article on GenomeMatcher and to indicate the URL from which you downloaded GenomeMatcher.
Our article on GenoemMatcher
GenomeMatcher: A graphical user interface for DNA sequence comparison.
BMC Bioinformatics 2008, 9:376 (16 September 2008)